Introduction
The legalization of name, image, and likeness (NIL) and the "one time transfer rule" has caused major changes in collegiate athletics over the past couple of years. In large part due to these changes, the rising number of transfers has led to the transfer portal being one of the most important recruiting factors for college basketball teams to monitor. Whether a team is looking for a roster overhaul with a new coach, or looking to find the last missing piece to fill out their roster, the transfer portal provides potential solutions to traditional problems in roster construction. Unfortunately, not all transfers turn into success stories at their new schools. It takes great effort, skill, and a little bit of luck to evaluate which transfers each year will be effective players at their new schools. I built my transfer model to use as a tool in evaluating which transfers will be effective players at their new schools. I will go into a lot of detail about my model and process throughout this page, but for now I will start by describing the data I used.
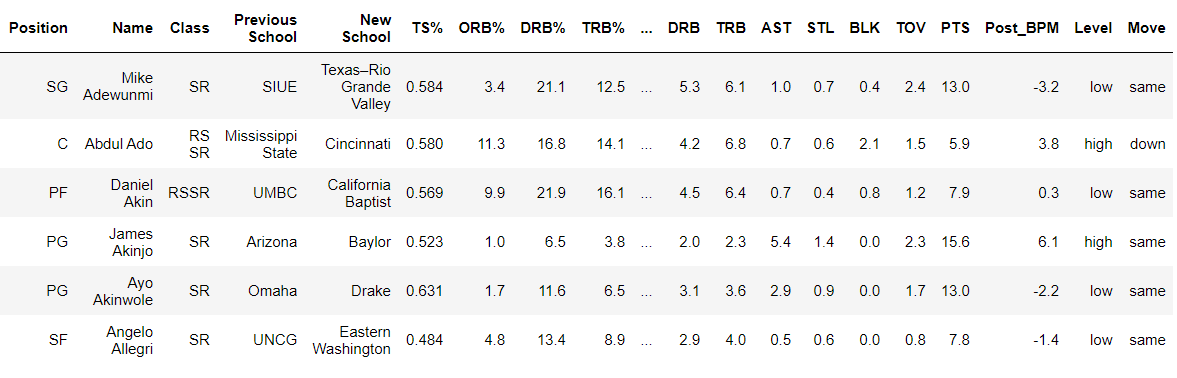
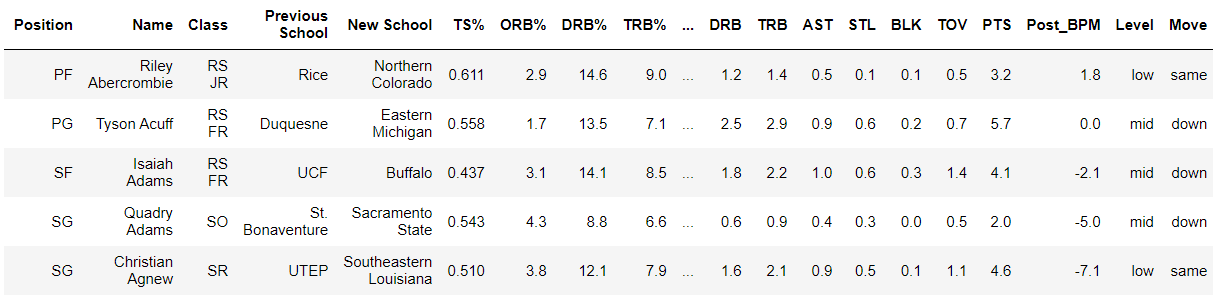
To create an effective transfer model, I first needed to acquire data on which players were transferring, where they were transferring to, their stats for the year before transferring (to use as feature data), information about their season after transferring (whether they moved to a better conference, etc.), and a measurement of performance for their year after transferring (Box Plus Minus). The post transfer season BPM is the "target" data that I attempt to predict. I acquired the data about transfers and where they were transferring to from the verbal commits website, and I acquired all the player stats from basketball reference. After cleaning and merging the data, I was able to construct a dataset that contained a player's stats, transfer information, pre transfer performance, and post transfer performance. An example of what this data looks like can be seen in Figure 1. I'll go into more detail about what some of those columns mean later on if there is any confusion, but the general gist of what the data looks like can be seen in that figure. One important thing to note is that only players who played 75% of their team's games in both their pre transfer AND post transfer season are included in the data. This criteria was established so that there was a sufficient sample size for each player.
Method
Before I could get into the actual modeling, I created two categorical features called “level” and “move”. The feature “level” was created to hold information on the level of competition a player was playing at before transferring. The categories of level are “high” (Big 10, Big 12, SEC, ACC, Pac 12, Big East), “mid” (WCC, Mountain West, AAC, A10), and “low” (the rest of the conferences). I decided to categorize each conference according to how many teams the conference consistently sends to the NCAA Tournament. Low major conferences are one bid leagues, while mid major conferences typically send between two and four teams to the tournament. High major conferences consistently send four or more teams to the tournament. The feature “move” takes each player's pre transfer conference and post transfer conference into account and categorizes the change in competition as one of the following five options: “2 down”, “down”, “same”, “up”, “2 up”. To provide an example, Justin Ahrens played at Michigan State (Big 10) in the 2021-22 season and transferred to Loyola Marymount (WCC) for the 2022-23 season. For Justin's case, he would be given the “high” (Big 10) categorization for the “level” feature and a “down” (high to mid) categorization for the “move” feature.
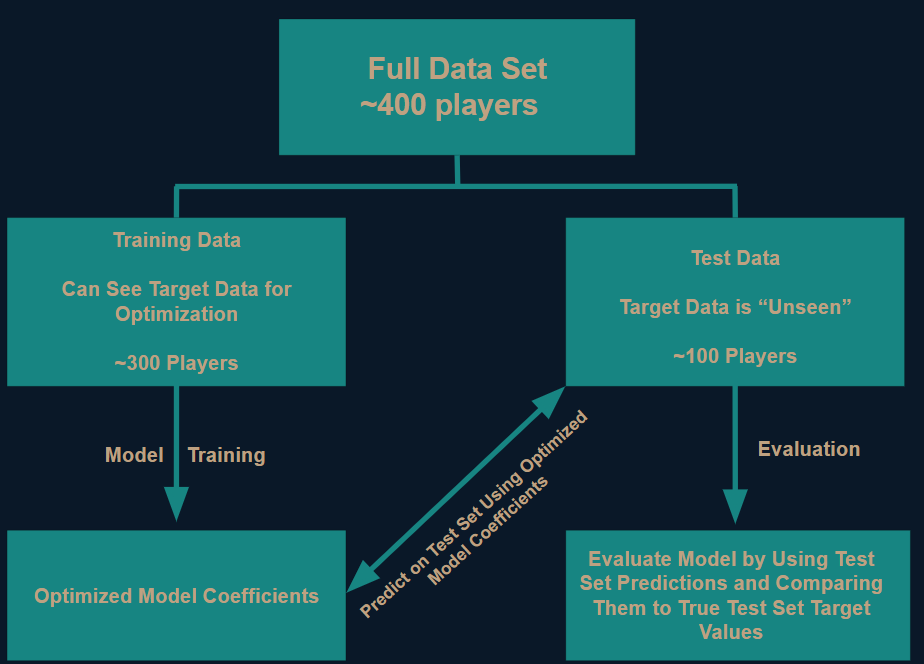
I used the dataset with player stats from the 2020-21 season to train a model to predict each player's post transfer season BPM (2021-22 season in this case). To do this, I performed a randomized 75%/25% train/test split. In other words, I randomly took 75% of the data (about 300 players) as a training set, and I trained several different models to predict the player's post transfer BPM. These models were able to see the actual post transfer BPM in order to optimize the coefficients for each feature. Next, I used the models that I just trained to make predictions on the remaining 25% of the data. This remaining test set contained “unseen” data, as the models were not able to see the true post transfer BPM like they could with the training set. This allowed me to evaluate how good the model was by taking the predicted values and seeing how close they were to the actual post transfer BPM values. Figure 2 illustrates this process.
Model Pre-Processing
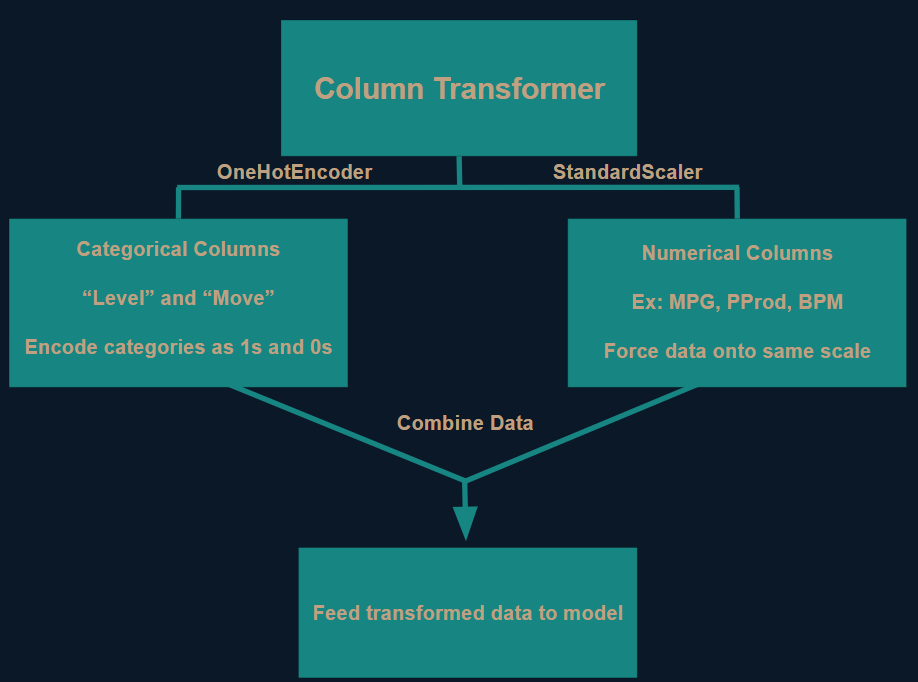
For these models to be as effective as possible, I needed to perform some pre-processing steps so that my models could understand the data. I used Scikit-Learn's “Column Transformer” to make the necessary modifications. For the “level” and “move” columns I encoded each category as a 1 if that category described the player and 0 otherwise. This led to the creation of eight new columns: one for each of the three categorizations of “level” and one for each of the five categorizations of “move”. For example, Justin Ahrens would have a value of 1 for the columns “high” and “down”, and a value of 0 for the remaining six categorization columns. This encoding was necessary because the models can only understand numerical data, and “level” and “move” are categorical columns.
The other preprocessing step I needed to do was to “standardize” the numerical value columns. What this means is that I transformed the columns to reflect how much more or less feature values were than their feature average, while taking into account the standard deviation. This is important because the scales of each column vary. For example, a player can play 40 minutes a game (MPG feature) while producing 100 points on the season (PProd feature). In a raw sense, 100 is much larger than 40; however, compared to the average, 40 minutes per game is well above average, while 100 points produced is well below average. Certain kinds of models are not able to account for different scales, so by comparing each feature value to its average value (and accounting for each feature's standard deviation), you force all the features onto the same scale. You can read here for more details on standardization.
Model Results
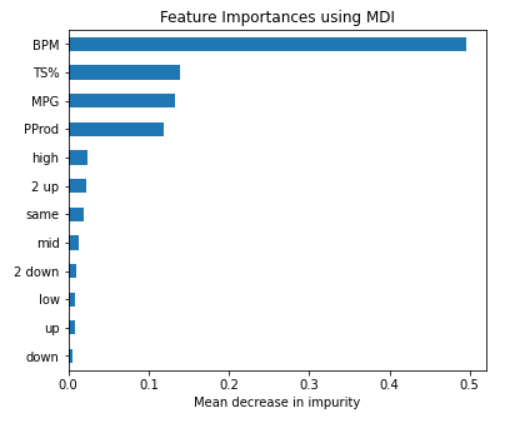
After creating the features “level” and “move” and applying the appropriate pre-processing steps to the data, I selected which features to use in the models. I performed several rounds of model testing and feature exploration to narrow down which features appeared to be the most important. I then explored different combinations of those features and examined their impact on model score to get to the final few possibilities. In the end, I decided to use the following features for my models: minutes per game, pre transfer BPM, points produced, true shooting percentage, low, mid, high, 2 down, down, same, up, and 2 up. The last eight of those features are the encoded category values of the “level” and “move” features. There were some different feature combinations that provided marginal model score improvements that only included “down”, “2 down”, and “high” out of the eight encoded features. I decided to include them all despite the very slight decrease in score as I believed that including all of them increased the interpretability and made for a more intuitive model. Figure 4 provides a visual of the feature importance of the final combination of features that I used for my model. Pre transfer BPM was clearly the most important feature, but as I will detail in the next paragraph, adding the other features led to a substantial improvement in model score. Another thing to note is that each of the eight encoded features by themselves are not very important, but taking them all together does make an impact on the model.
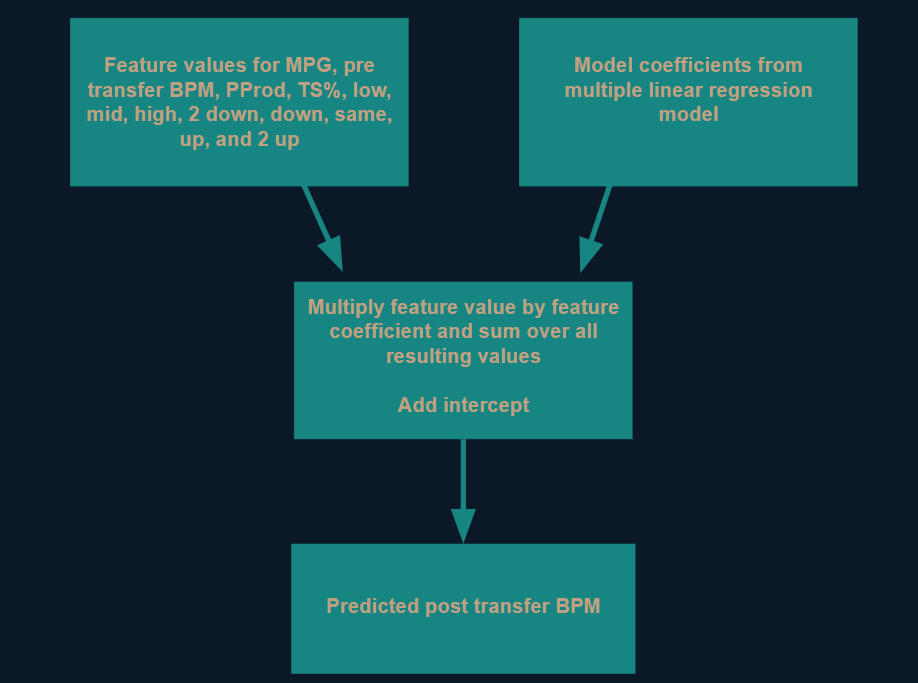
As I mentioned previously, I trained multiple different kinds of models as I wanted to see which one was most effective for this data set. I tested several kinds of regression models such as multiple linear regression and ridge regression as well as a couple ensemble methods such as random forest regression and gradient boosting regression. In the end, the multiple regression model proved to be the most effective method for modeling this data regardless of what features were used. For the final multiple linear regression model I used, I was able to achieve an R-squared value of .406. This means that my model was able to explain almost 41% of the variation in post transfer BPM. While obviously I would like that percentage to be as close to 100% as possible, 41% is quite good considering all the variables at play that are not quantifiable. Factors such as moving to a new place, playing in a new system, offseason skill improvement (or decline), and numerous other things all contribute to how well a player plays after transferring. Additionally, this model served as a clear improvement over the baseline model that I created which only used pre transfer BPM to predict post transfer BPM. This baseline model had an R-squared value of .255. My model was able to explain over 15% more of the variation in post transfer BPM than the baseline model could. The random forest model also outperformed the baseline model with an R-squared score of .313, but this model was not able to produce as effective results as the multiple regression model.
Predictions for the 2022-23 Season
I applied my final model to the dataset with the 2021-22 pre transfer season data to generate the 2022-23 post transfer predictions.
*Players must have played 75% of their teams games in both the 2021-22 and 2022-23 season to be included.*
| Position | Name | Previous School | New School | Predicted | |
|---|---|---|---|---|---|
| 288 | G | Nijel Pack | Kansas State | Miami | 7.45 |
| 266 | F | Pete Nance | Northwestern | North Carolina | 6.87 |
| 233 | F | Matthew Mayer | Baylor | Illinois | 6.84 |
| 47 | F | Johni Broome | Morehead State | Auburn | 6.21 |
| 194 | F | David Jones | DePaul | St. John's | 6.11 |
| 401 | C | K.J. Williams | Murray State | LSU | 5.97 |
| 129 | G | Andersson Garcia | Mississippi State | Texas A&M | 5.76 |
| 320 | G | Terry Roberts | Bradley | Georgia | 5.73 |
| 335 | G | Baylor Scheierman | South Dakota State | Creighton | 5.72 |
| 177 | G | Tyrese Hunter | Iowa State | Texas | 5.68 |
| 357 | G | Erik Stevenson | South Carolina | West Virginia | 5.67 |
| 141 | G | Jacob Grandison | Illinois | Duke | 5.48 |
| 45 | F | Jalen Bridges | West Virginia | Baylor | 5.35 |
| 337 | G | Mark Sears | Ohio | Alabama | 5.35 |
| 41 | G | Souley Boum | UTEP | Xavier | 5.34 |
| 393 | G | Rondel Walker | Oklahoma State | TCU | 5.28 |
| 310 | G | Courtney Ramey | Texas | Arizona | 5.27 |
| 132 | G | Umoja Gibson | Oklahoma | DePaul | 5.27 |
| 46 | F | Keion Brooks | Kentucky | Washington | 5.21 |
| 413 | G | Jahmir Young | Charlotte | Maryland | 5.18 |
| 354 | G | Cam Spencer | Loyola (MD) | Rutgers | 5.17 |
| 216 | G | Isaac Likekele | Oklahoma State | Ohio State | 5.16 |
| 282 | F | Norchad Omier | Arkansas State | Miami | 5.11 |
| 66 | F | Noah Carter | Northern Iowa | Missouri | 5.01 |
| 240 | F | Jayveous McKinnis | Jackson State | Ole Miss | 4.92 |
| 102 | G | Greg Elliott | Marquette | Pittsburgh | 4.83 |
| 386 | F | Ben Vander Plas | Ohio | Virginia | 4.76 |
| 263 | G | Brandon Murray | LSU | Georgetown | 4.73 |
| 166 | G | D'Moi Hodge | Cleveland State | Missouri | 4.71 |
| 284 | C | Osun Osunniyi | St. Bonaventure | Iowa State | 4.68 |
| 122 | F | Alex Fudge | LSU | Florida | 4.65 |
| 242 | G | Sean McNeil | West Virginia | Ohio State | 4.64 |
| 164 | G | Justice Hill | Murray State | LSU | 4.63 |
| 377 | G | Joe Toussaint | Iowa | West Virginia | 4.63 |
| 139 | F | Jalen Graham | Arizona State | Arkansas | 4.59 |
| 65 | G | Devin Carter | South Carolina | Providence | 4.56 |
| 109 | G | Francisco Farabello | TCU | Creighton | 4.55 |
| 272 | G | Tristen Newton | East Carolina | Connecticut | 4.47 |
| 130 | F | Juwan Gary | Alabama | Nebraska | 4.38 |
| 154 | G | De'Vion Harmon | Oregon | Texas Tech | 4.38 |
| 307 | G | Justin Powell | Tennessee | Washington State | 4.34 |
| 19 | G | Caleb Asberry | Texas State | Oklahoma State | 4.32 |
| 236 | G | Mardrez McBride | North Texas | Georgia | 4.29 |
| 87 | G | Al-Amir Dawes | Clemson | Seton Hall | 4.25 |
| 61 | G | Devan Cambridge | Auburn | Arizona State | 4.23 |
| 18 | G | Tyree Appleby | Florida | Wake Forest | 4.21 |
| 316 | G | Will Richard | Belmont | Florida | 4.20 |
| 165 | G | Justin Hill | Longwood | Georgia | 4.20 |
| 26 | F | Grant Basile | Wright State | Virginia Tech | 4.19 |
| 152 | G | Trae Hannibal | Murray State | LSU | 4.16 |
| 379 | G | Darrion Trammell | Seattle | San Diego State | 4.09 |
| 313 | G | Antonio Reeves | Illinois State | Kentucky | 4.09 |
| 74 | G | Ta'Lon Cooper | Morehead State | Minnesota | 4.08 |
| 168 | G | Tanner Holden | Wright State | Ohio State | 4.08 |
| 85 | G | Kendric Davis | SMU | Memphis | 4.05 |
| 196 | G | Michael Jones | Davidson | Stanford | 4.00 |
| 218 | G | Kyle Lofton | St. Bonaventure | Florida | 3.95 |
| 414 | C | Ryan Young | Northwestern | Duke | 3.91 |
| 171 | G | Nick Honor | Clemson | Missouri | 3.78 |
| 10 | G | Nahiem Alleyne | Virginia Tech | Connecticut | 3.78 |
| 146 | G | Sam Griesel | North Dakota State | Nebraska | 3.75 |
| 315 | G | Sir'Jabari Rice | New Mexico State | Texas | 3.74 |
| 298 | F | Eral Penn | LIU | DePaul | 3.74 |
| 170 | G | Jaren Holmes | St. Bonaventure | Iowa State | 3.68 |
| 323 | G | Luis Rodriguez | Ole Miss | UNLV | 3.67 |
| 90 | G | Hassan Diarra | Texas A&M | Connecticut | 3.66 |
| 261 | G | Jabe Mullins | Saint Mary's | Washington State | 3.63 |
| 49 | F | Hayden Brown | The Citadel | South Carolina | 3.61 |
| 321 | G | Tyrell Roberts | Washington State | San Francisco | 3.57 |
| 397 | G | D'maurian Williams | Gardner�Webb | Texas Tech | 3.54 |
| 254 | F | Clifton Moore | La Salle | Providence | 3.53 |
| 89 | G | Dexter Dennis | Wichita State | Texas A&M | 3.53 |
| 409 | G | Ethan Wright | Princeton | Colorado | 3.48 |
| 340 | G | Grant Sherfield | Nevada | Oklahoma | 3.45 |
| 366 | G | Lance Terry | Gardner�Webb | Georgia Tech | 3.41 |
| 412 | G | Camren Wynter | Drexel | Penn State | 3.40 |
| 217 | G | Noah Locke | Louisville | Providence | 3.38 |
| 395 | F | Hason Ward | VCU | Iowa State | 3.34 |
| 391 | C | Qudus Wahab | Maryland | Georgetown | 3.33 |
| 410 | G | John-Michael Wright | High Point | Oklahoma State | 3.33 |
| 145 | G | Tykei Greene | Stony Brook | Kansas State | 3.32 |
| 210 | G | Max Klesmit | Wofford | Wisconsin | 3.30 |
| 84 | G | Dre Davis | Louisville | Seton Hall | 3.29 |
| 83 | G | Dashawn Davis | Oregon State | Mississippi State | 3.29 |
| 24 | G | Emmanuel Bandoumel | SMU | Nebraska | 3.19 |
| 8 | C | Theo Akwuba | Louisiana | Ole Miss | 3.18 |
| 128 | G | Brevin Galloway | Boston College | Clemson | 3.12 |
| 127 | G | Eric Gaines | LSU | UAB | 3.10 |
| 277 | G | Femi Odukale | Pittsburgh | Seton Hall | 3.06 |
| 172 | F | Bryce Hopkins | Kentucky | Providence | 3.06 |
| 252 | F | Matthew-Alexander Moncrieffe | Oklahoma State | Georgia | 3.04 |
| 14 | G | Ethan Anderson | USC | Wyoming | 3.01 |
| 215 | F | Wildens Leveque | South Carolina | Massachusetts | 3.00 |
| 73 | G | Frankie Collins | Michigan | Arizona State | 2.98 |
| 402 | G | Rudi Williams | Coastal Carolina | Brigham Young | 2.95 |
| 356 | C | Jake Stephens | VMI | Chattanooga | 2.89 |
| 64 | F | Andrew Carr | Delaware | Wake Forest | 2.85 |
| 178 | F | Brandon Huntley-Hatfield | Tennessee | Louisville | 2.84 |
| 342 | G | Desi Sills | Arkansas State | Kansas State | 2.84 |
| 63 | F | Ben Carlson | Wisconsin | Utah | 2.84 |
| 229 | F | Julius Marble | Michigan State | Texas A&M | 2.79 |
| 223 | G | Mason Madsen | Cincinnati | Boston College | 2.78 |
| 71 | C | Kendal Coleman | Northwestern State | LSU | 2.78 |
| 173 | G | Jamel Horton | Albany | Mississippi State | 2.75 |
| 40 | G | Trey Bonham | VMI | Florida | 2.74 |
| 21 | F | Joey Baker | Duke | Michigan | 2.74 |
| 249 | F | Makhi Mitchell | Rhode Island | Arkansas | 2.67 |
| 221 | G | Jarod Lucas | Oregon State | Nevada | 2.65 |
| 226 | G | Ezra Manjon | UC Davis | Vanderbilt | 2.60 |
| 69 | G | Jack Clark | La Salle | NC State | 2.56 |
| 137 | G | Tre Gomillion | Cleveland State | Missouri | 2.55 |
| 57 | C | D.J. Burns | Winthrop | NC State | 2.54 |
| 394 | F | Kerwin Walton | North Carolina | Texas Tech | 2.53 |
| 125 | F | Taylor Funk | Saint Joseph's | Utah State | 2.48 |
| 234 | F | Josh Mballa | Buffalo | Ole Miss | 2.48 |
| 259 | F | Bryson Mozone | USC Upstate | Georgetown | 2.45 |
| 308 | C | Neal Quinn | Lafayette | Richmond | 2.45 |
| 101 | G | Sheldon Edwards | Valparaiso | Loyola Chicago | 2.44 |
| 246 | G | Selton Miguel | Kansas State | South Florida | 2.42 |
| 159 | G | Cam Hayes | NC State | LSU | 2.35 |
| 77 | F | Matt Cross | Louisville | Massachusetts | 2.32 |
| 399 | G | Donovan Williams | Oklahoma State | Pacific | 2.30 |
| 136 | F | Bryce Golden | Butler | Loyola Chicago | 2.29 |
| 302 | G | Javon Pickett | Missouri | Saint Louis | 2.27 |
| 4 | F | Justin Ahrens | Ohio State | Loyola Marymount | 2.25 |
| 303 | G | Xavier Pinson | LSU | New Mexico State | 2.23 |
| 404 | F | Samuell Williamson | Louisville | SMU | 2.21 |
| 142 | G | Dae Dae Grant | Miami (OH) | Duquesne | 2.18 |
| 219 | F | Caleb Lohner | Brigham Young | Baylor | 2.15 |
| 358 | F | Tyler Stevenson | Southern Miss | UIC | 2.12 |
| 230 | F | Brandon Martin | South Carolina | Massachusetts | 2.06 |
| 16 | C | Frank Anselem | Syracuse | Georgia | 2.04 |
| 227 | G | Jamaine Mann | Vanderbilt | Georgia State | 1.94 |
| 124 | G | Andrew Funk | Bucknell | Penn State | 1.89 |
| 389 | F | Tydus Verhoeven | UTEP | Northwestern | 1.85 |
| 79 | G | Nelly Cummings | Colgate | Pittsburgh | 1.76 |
| 339 | G | Sam Sessoms | Penn State | Coppin State | 1.73 |
| 140 | F | Michael Graham | Elon | Loyola Marymount | 1.66 |
| 238 | G | Courvoisier McCauley | DePaul | Indiana State | 1.64 |
| 131 | G | DeAndre Gholston | Milwaukee | Missouri | 1.63 |
| 257 | F | Khalid Moore | Georgia Tech | Fordham | 1.51 |
| 17 | F | Emmanuel Ansong | Green Bay | Vanderbilt | 1.48 |
| 331 | G | Taurus Samuels | Dartmouth | Minnesota | 1.48 |
| 44 | G | Tevin Brewer | Florida International | Duquesne | 1.43 |
| 97 | C | Michael Durr | Indiana | UCF | 1.41 |
| 104 | F | Tristan Enaruna | Iowa State | Cleveland State | 1.40 |
| 255 | F | Isaih Moore | Southern Miss | Fresno State | 1.36 |
| 96 | F | Hassan Drame | Saint Peter's | La Salle | 1.33 |
| 135 | F | Sam Godwin | Wofford | Oklahoma | 1.33 |
| 169 | F | Collin Holloway | Georgetown | Tulane | 1.32 |
| 211 | G | Seneca Knight | Brigham Young | Illinois State | 1.30 |
| 361 | G | Tai Strickland | Temple | Georgia Southern | 1.26 |
| 181 | G | Tre Jackson | Iowa State | Western Carolina | 1.26 |
| 276 | G | Dwon Odom | Xavier | Georgia State | 1.22 |
| 42 | C | Davion Bradford | Kansas State | Wake Forest | 1.21 |
| 59 | G | Joey Calcaterra | San Diego | Connecticut | 1.19 |
| 143 | G | Qua Grant | Wichita State | Sam Houston State | 1.17 |
| 126 | G | Jalen Gaffney | Connecticut | Florida Atlantic | 1.16 |
| 291 | F | Micah Parrish | Oakland | San Diego State | 1.04 |
| 363 | F | Brandon Suggs | East Carolina | UCF | 1.02 |
| 133 | G | Montre' Gipson | Tarleton State | Charlotte | 0.99 |
| 148 | F | Felipe Haase | Mercer | Southern Miss | 0.99 |
| 368 | F | Dischon Thomas | Colorado State | Montana | 0.94 |
| 7 | G | Emmanuel Akot | Boise State | Western Kentucky | 0.93 |
| 301 | G | Nelson Phillips | Georgia State | Troy | 0.89 |
| 305 | C | Mylyjael Poteat | Rice | Virginia Tech | 0.89 |
| 103 | F | Patrick Emilien | St. Francis Brooklyn | Maryland | 0.88 |
| 27 | F | Riley Battin | Utah | California Baptist | 0.87 |
| 270 | G | Jordan Nesbitt | Saint Louis | Hampton | 0.75 |
| 28 | F | Noah Baumann | Georgia | GCU | 0.74 |
| 367 | C | Lahat Thioune | Utah | UCF | 0.73 |
| 95 | F | Fousseyni Drame | Saint Peter's | La Salle | 0.73 |
| 375 | G | Earl Timberlake | Memphis | Bryant | 0.70 |
| 359 | G | Parker Stewart | Indiana | UT Martin | 0.66 |
| 347 | C | David Skogman | Buffalo | Davidson | 0.65 |
| 110 | G | Nick Farrar | College of Charleston | UNCW | 0.65 |
| 256 | G | Kendle Moore | Colorado State | Missouri State | 0.65 |
| 311 | F | Ahmad Rand | Oregon State | Milwaukee | 0.65 |
| 239 | G | Kamari McGee | Green Bay | Wisconsin | 0.64 |
| 15 | C | Eduardo Andre | Nebraska | Fresno State | 0.61 |
| 317 | F | Dalen Ridgnal | Georgia | Missouri State | 0.60 |
| 353 | F | Calvin Solomon | Stephen F. Austin | UTEP | 0.60 |
| 5 | F | Daniel Akin | California Baptist | Utah State | 0.58 |
| 78 | G | Austin Crowley | Ole Miss | Southern Miss | 0.57 |
| 182 | F | Austin Johnson | UC Irvine | North Carolina A&T | 0.57 |
| 116 | G | Moses Flowers | Hartford | St. Bonaventure | 0.56 |
| 373 | G | Isaiah Thompson | Purdue | Florida Gulf Coast | 0.55 |
| 144 | F | Malek Green | Canisius | Youngstown State | 0.55 |
| 39 | F | Nelson Boachie-Yiadom | Davidson | Hofstra | 0.52 |
| 108 | F | Tra'Von Fagan | Buffalo | UMBC | 0.51 |
| 275 | F | Efe Odigie | Troy | SMU | 0.50 |
| 328 | G | Jayden Saddler | Southern | Saint Peter's | 0.49 |
| 279 | F | Gus Okafor | Southeastern Louisiana | Wichita State | 0.48 |
| 99 | G | Doug Edert | Saint Peter's | Bryant | 0.46 |
| 34 | G | Isaiah Bigelow | Wofford | Richmond | 0.41 |
| 53 | F | Mikeal Brown-Jones | VCU | UNCG | 0.40 |
| 70 | G | Jarron Coleman | Missouri | Ball State | 0.35 |
| 202 | G | Luke Kasubke | Kansas State | Illinois State | 0.33 |
| 381 | G | Marcus Tsohonis | VCU | Long Beach State | 0.32 |
| 289 | F | Jay Pal | Jacksonville State | Campbell | 0.32 |
| 392 | F | Antwan Walker | Rhode Island | Bryant | 0.30 |
| 344 | G | Saquan Singleton | New Mexico | George Mason | 0.30 |
| 243 | C | Callum McRae | UC Riverside | Sacramento State | 0.22 |
| 309 | G | Joe Quintana | Loyola Marymount | California Baptist | 0.20 |
| 55 | G | Darius Burford | Elon | Illinois State | 0.18 |
| 385 | F | Morris Udeze | Wichita State | New Mexico | 0.17 |
| 81 | G | Amari Davis | Missouri | Wright State | 0.16 |
| 175 | G | Jaylin Hunter | Old Dominion | Ohio | 0.15 |
| 29 | G | Tyler Beard | Georgetown | Pacific | 0.10 |
| 180 | F | Clarence Jackson | Wichita State | Jacksonville State | 0.09 |
| 157 | G | Rayshon Harrison | Presbyterian | GCU | 0.08 |
| 411 | G | Ricardo Wright | Marist | SMU | 0.08 |
| 297 | G | Dylan Penn | Bellarmine | Vermont | 0.05 |
| 119 | G | Brayon Freeman | George Washington | Rhode Island | 0.02 |
| 330 | C | Kevin Samuel | Florida Gulf Coast | South Alabama | -0.01 |
| 304 | F | Joe Pleasant | Wichita State | Abilene Christian | -0.03 |
| 212 | G | Connor Kochera | William & Mary | Davidson | -0.06 |
| 204 | G | C.J. Kelly | Massachusetts | UCF | -0.06 |
| 295 | F | Omar Payne | Illinois | Jacksonville | -0.08 |
| 151 | G | Trendon Hankerson | Northern Illinois | Akron | -0.15 |
| 6 | F | Kaodirichi Akobundu-Ehiogu | UT Arlington | Memphis | -0.16 |
| 33 | G | Brandon Betson | Chicago State | Tulsa | -0.17 |
| 31 | G | Xavier Bell | Drexel | Wichita State | -0.18 |
| 273 | F | Madiaw Niang | Florida Atlantic | Radford | -0.20 |
| 107 | G | Onyebuchi Ezeakudo | Pittsburgh | Radford | -0.21 |
| 324 | F | Clarence Rupert | Saint Peter's | Southern Illinois | -0.24 |
| 293 | G | Austin Patterson | Wofford | Sacramento State | -0.27 |
| 37 | G | Ja'Monta Black | Missouri State | Northwestern State | -0.28 |
| 265 | F | Jay Nagle | UC Santa Barbara | Idaho State | -0.29 |
| 237 | G | Elijah McCadden | Georgia Southern | Memphis | -0.35 |
| 220 | G | Kyrell Luc | Holy Cross | St. Bonaventure | -0.36 |
| 341 | G | David Shriver | Hartford | VCU | -0.37 |
| 193 | G | Chase Johnston | Stetson | Florida Gulf Coast | -0.38 |
| 54 | G | Paul Bruns | North Dakota | South Dakota | -0.40 |
| 362 | G | Deon Stroud | Fresno State | Eastern Washington | -0.42 |
| 198 | F | Kur Jongkuch | Northern Colorado | Temple | -0.42 |
| 232 | F | Jayden Martinez | New Hampshire | North Texas | -0.42 |
| 322 | G | Jason Roche | The Citadel | Richmond | -0.43 |
| 123 | G | Caleb Fuller | UC Davis | Montana State | -0.44 |
| 206 | G | Keondre Kennedy | UMBC | UNCG | -0.44 |
| 244 | C | Braxton Meah | Fresno State | Washington | -0.47 |
| 214 | G | Ryan Larson | Wofford | College of Charleston | -0.48 |
| 346 | C | Moulaye Sissoko | Dayton | North Texas | -0.48 |
| 294 | G | Lu'Cye Patterson | Missouri State | Charlotte | -0.49 |
| 98 | G | Tyree Eady | North Dakota State | North Texas | -0.50 |
| 105 | G | Bryson Etienne | Texas Southern | Southern | -0.53 |
| 269 | F | Marek Nelson | Texas�Rio Grande Valley | Nicholls | -0.54 |
| 312 | G | Christian Ray | La Salle | Delaware | -0.55 |
| 222 | C | Nic Lynch | Lehigh | San Diego | -0.56 |
| 264 | F | Patrick Mwamba | UT Arlington | Oral Roberts | -0.57 |
| 88 | G | Duke Deen | Troy | Bradley | -0.60 |
| 121 | F | Drew Friberg | Princeton | Belmont | -0.61 |
| 22 | G | Josh Baker | UNLV | GCU | -0.64 |
| 268 | F | Adrian Nelson | Northern Kentucky | Youngstown State | -0.65 |
| 187 | G | Jamal Johnson | UAB | Chattanooga | -0.65 |
| 43 | G | Ledarrius Brewer | ETSU | UAB | -0.65 |
| 23 | C | Aziz Bandaogo | Akron | Utah Valley | -0.66 |
| 75 | F | Tyree Corbett | Coppin State | Denver | -0.68 |
| 86 | G | Tyreese Davis | Jacksonville | Eastern Washington | -0.69 |
| 134 | G | Shamar Givance | Evansville | UTEP | -0.72 |
| 80 | G | Kamdyn Curfman | VMI | Marshall | -0.74 |
| 306 | G | Skyelar Potter | Morehead State | Jacksonville State | -0.75 |
| 35 | F | Jalin Billingsley | Georgetown | Eastern Michigan | -0.78 |
| 100 | G | Malik Edmead | Merrimack | Albany | -0.79 |
| 332 | G | Colton Sandage | Western Illinois | Illinois State | -0.81 |
| 94 | G | Shaun Doss | SIUE | Arkansas�Pine Bluff | -0.82 |
| 382 | G | Brenden Tucker | College of Charleston | Georgia State | -0.84 |
| 106 | C | Kaosi Ezeagu | Kansas State | Sam Houston State | -0.88 |
| 52 | F | Rod Brown | Jacksonville | Tarleton State | -0.89 |
| 163 | F | Anquan Hill | Fairleigh Dickinson | St. Bonaventure | -0.91 |
| 161 | F | Jordan Henderson | McNeese | Lamar State College�Port Arthur | -0.92 |
| 384 | G | Kellen Tynes | Montana State | Maine | -0.93 |
| 364 | G | Raheim Sullivan | Marist | NJIT | -0.93 |
| 2 | F | Isaiah Adams | UCF | Buffalo | -0.94 |
| 114 | G | Jalen Finch | Jacksonville State | Georgia Southern | -0.97 |
| 278 | F | Mezie Offurum | Mount St. Mary's | James Madison | -0.98 |
| 333 | G | Jorell Saterfield | UTEP | Portland State | -0.99 |
| 348 | G | Tahj Small | Tarleton State | Utah Valley | -1.00 |
| 388 | C | Chad Venning | Morgan State | St. Bonaventure | -1.00 |
| 138 | F | Hunter Goodrick | South Dakota | California Baptist | -1.00 |
| 383 | F | Luke Turner | Wofford | UC Riverside | -1.01 |
| 365 | G | Blondeau Tchoukuiegno | New Hampshire | California Baptist | -1.02 |
| 38 | G | Jamari Blackmon | North Alabama | Louisiana�Monroe | -1.03 |
| 326 | G | Nygal Russell | Southeast Missouri State | Towson | -1.03 |
| 292 | G | Sarju Patel | Cornell | Albany | -1.03 |
| 290 | G | Cameron Parker | Montana | Portland State | -1.05 |
| 147 | F | Nick Guadarrama | New Hampshire | Florida International | -1.06 |
| 253 | G | Aanen Moody | Southern Utah | Montana | -1.08 |
| 415 | F | Dima Zdor | GCU | Texas�Rio Grande Valley | -1.08 |
| 56 | G | Caleb Burgess | Hofstra | UNC Asheville | -1.12 |
| 300 | F | Joe Petrakis | Western Carolina | Illinois State | -1.13 |
| 112 | G | Caleb Fields | Bowling Green | Fairfield | -1.17 |
| 50 | G | Jomaru Brown | Eastern Kentucky | Coastal Carolina | -1.19 |
| 30 | F | Braden Bell | Marist | Prairie View A&M | -1.22 |
| 398 | G | Desmond Williams | Troy | UT Martin | -1.29 |
| 176 | F | Sammy Hunter | Ole Miss | Akron | -1.30 |
| 407 | F | Hunter Woods | Elon | Portland State | -1.30 |
| 200 | C | Isaac Kante | LIU | Massachusetts | -1.30 |
| 12 | F | Alex Anderson | South Alabama | Alabama State | -1.30 |
| 355 | C | Joey St. Pierre | Milwaukee | Portland | -1.32 |
| 199 | G | Gedi Juozapaitis | Georgia Southern | Maine | -1.36 |
| 225 | F | Dravon Mangum | Radford | Louisiana Tech | -1.37 |
| 372 | G | Tyler Thomas | Sacred Heart | Hofstra | -1.39 |
| 329 | G | Morgan Safford | Wofford | Miami (OH) | -1.42 |
| 208 | C | Lukas Kisunas | Stanford | Denver | -1.42 |
| 62 | G | Kyle Cardaci | Coppin State | Saint Peter's | -1.42 |
| 369 | G | Kalil Thomas | UMass Lowell | Morehead State | -1.45 |
| 286 | G | L.J. Owens | UMBC | Delaware | -1.45 |
| 36 | G | Dahmir Bishop | Saint Joseph's | Florida Gulf Coast | -1.45 |
| 280 | G | Toby Okani | Duquesne | UIC | -1.45 |
| 11 | G | Kellen Amos | Binghamton | Central Connecticut State | -1.46 |
| 235 | G | Bryce McBride | Eastern Michigan | Youngstown State | -1.47 |
| 400 | G | Jelani Williams | Penn | Howard | -1.50 |
| 327 | F | Nikkei Rutty | Monmouth | Prairie View A&M | -1.50 |
| 197 | G | Russell Jones | Winthrop | Western Carolina | -1.52 |
| 396 | G | Dalvin White | USC Upstate | Chattanooga | -1.53 |
| 338 | F | Jaylen Sebree | Morehead State | Tennessee Tech | -1.53 |
| 117 | G | Ahamadou Fofana | Canisius | Maryland Eastern Shore | -1.55 |
| 376 | F | George Tinsley | Binghamton | Mount St. Mary's | -1.57 |
| 274 | G | DQ Nicholas | Southeast Missouri State | Gardner�Webb | -1.58 |
| 271 | G | Donovan Newby | Milwaukee | UNCW | -1.61 |
| 1 | G | Tyson Acuff | Duquesne | Eastern Michigan | -1.62 |
| 370 | G | Micah Thomas | Indiana State | Nicholls | -1.66 |
| 153 | G | Maleeck Harden-Hayes | North Dakota State | UNCW | -1.67 |
| 262 | F | Kendall Munson | Pepperdine | Portland State | -1.68 |
| 150 | G | Isaac Haney | Missouri State | Northwestern State | -1.73 |
| 72 | F | Noah Collier | Pittsburgh | William & Mary | -1.73 |
| 390 | F | Garrison Wade | Dartmouth | Cal State Fullerton | -1.74 |
| 318 | G | Anthony Roberts | St. Cloud State | Purdue Fort Wayne | -1.75 |
| 9 | F | Josh Aldrich | USC Upstate | Charlotte | -1.78 |
| 174 | F | Chance Hunter | California Baptist | Cal Poly | -1.79 |
| 207 | G | Jayson Kent | Bradley | Indiana State | -1.83 |
| 405 | G | Khaleb Wilson-Rouse | Pacific | New Orleans | -1.89 |
| 374 | G | Messiah Thompson | Campbell | Alabama A&M | -1.92 |
| 336 | G | Jordan Sears | Gardner�Webb | UT Martin | -1.93 |
| 231 | G | Judson Martindale | Holy Cross | Pacific | -1.94 |
| 325 | G | Brandon Rush | Fairleigh Dickinson | Youngstown State | -1.94 |
| 213 | F | Zool Kueth | Northern Illinois | Tennessee State | -1.95 |
| 32 | G | T.J. Berger | San Diego | Lafayette | -1.95 |
| 267 | G | Walyn Napper | Southern Miss | Longwood | -1.97 |
| 160 | G | Cameron Healy | Central Michigan | Southern Utah | -1.98 |
| 319 | G | C.J. Roberts | Lamar | Texas A&M�Commerce | -1.98 |
| 162 | G | Jeremiah Hernandez | Kent State | Southern Indiana | -1.98 |
| 51 | G | Kyree Brown | Seattle | New Hampshire | -1.99 |
| 91 | F | Kobe Dickson | Cornell | Howard | -2.01 |
| 371 | F | Miryne Thomas | Ball State | Kent State | -2.02 |
| 48 | G | Brandon Brown | Arkansas�Pine Bluff | Wagner | -2.07 |
| 248 | C | David Mitchell | Brown | Niagara | -2.08 |
| 113 | C | Kyler Filewich | Southern Illinois | Wofford | -2.09 |
| 167 | G | Jalen Hodge | James Madison | SIUE | -2.12 |
| 0 | F | Riley Abercrombie | Rice | Northern Colorado | -2.13 |
| 258 | G | Jamir Moultrie | Kennesaw State | Canisius | -2.13 |
| 58 | F | Cam Burrell | Western Illinois | Lindenwood | -2.14 |
| 20 | F | Jaxson Baker | Central Arkansas | New Hampshire | -2.15 |
| 201 | G | Joe Kasperzyk | Southeastern Louisiana | Niagara | -2.17 |
| 378 | F | Sam Towns | Ohio | Bowling Green | -2.17 |
| 299 | G | Tyrone Perry | Buffalo | New Haven | -2.17 |
| 241 | G | Trenton McLaughlin | Central Connecticut State | Northern Arizona | -2.20 |
| 406 | G | JaCobi Wood | Belmont | Murray State | -2.21 |
| 281 | G | Erik Oliver | South Dakota | Tennessee Tech | -2.23 |
| 350 | G | DaQuan Smith | Murray State | Radford | -2.29 |
| 260 | G | Chris Mullins | Rice | William & Mary | -2.30 |
| 408 | F | Trey Woodyard | Valparaiso | New Hampshire | -2.31 |
| 67 | F | Derrick Carter-Hollinger | Montana | Bethune�Cookman | -2.32 |
| 92 | C | Lewis Djonkam | Radford | Morgan State | -2.32 |
| 296 | C | Tamell Pearson | Western Illinois | Appalachian State | -2.34 |
| 120 | G | Mark Freeman | Illinois State | Morehead State | -2.35 |
| 82 | G | Brent Davis | The Citadel | Chicago State | -2.38 |
| 3 | G | Christian Agnew | UTEP | Southeastern Louisiana | -2.41 |
| 203 | F | Japannah Kellogg | Green Bay | Albany | -2.43 |
| 93 | F | Jarvis Doles | Albany | UMBC | -2.46 |
| 189 | F | Nathan Johnson | UMBC | Samford | -2.46 |
| 188 | G | Jordan Johnson | Denver | New Orleans | -2.48 |
| 228 | F | Romelle Mansel | Long Beach State | Jackson State | -2.50 |
| 247 | C | Anderson Mirambeaux | Cleveland State | Miami (OH) | -2.51 |
| 195 | G | Kanye Jones | Boston College | Buffalo | -2.55 |
| 205 | F | Jeremiah Kendall | Prairie View A&M | Alcorn State | -2.56 |
| 115 | G | Nick Fleming | Southern Utah | Cal Poly | -2.60 |
| 360 | G | Lucas Stieber | Green Bay | Gardner�Webb | -2.65 |
| 25 | F | Michael Barber | Alabama State | Mississippi Valley State | -2.66 |
| 283 | F | Kevin Osawe | Little Rock | NJIT | -2.68 |
| 60 | G | Alex Caldwell | North Carolina Central | UNC Asheville | -2.74 |
| 245 | C | Brendan Medley-Bacon | McNeese | North Carolina Central | -2.76 |
| 314 | G | Juan Reyna | Alabama State | Campbell | -2.91 |
| 403 | F | Warren Williams | Manhattan | Hofstra | -2.94 |
| 287 | G | Dylan O'Hearn | NJIT | Jacksonville | -3.09 |
| 209 | G | Maks Klanjscek | Maine | Houston Christian | -3.11 |
| 387 | F | Luka Vasic | Charlotte | Texas A&M�Commerce | -3.20 |
| 68 | C | Tanner Christensen | Idaho | Utah Tech | -3.20 |
| 345 | F | Blake Sisley | Evansville | Wright State | -3.22 |
| 179 | G | Ethan Igbanugo | North Dakota | Cal State Northridge | -3.23 |
| 380 | C | Emmanuel Tshimanga | UC Irvine | UC San Diego | -3.26 |
| 13 | G | Boogie Anderson | South Dakota | Southeastern Louisiana | -3.26 |
| 343 | F | Tafari Simms | Milwaukee | Western Michigan | -3.26 |
| 334 | G | Keshaun Saunders | Toledo | Portland State | -3.36 |
| 76 | G | Yuri Covington | William & Mary | UMass Lowell | -3.56 |
| 158 | F | Langdon Hatton | William & Mary | Bellarmine | -3.68 |
| 224 | C | Adong Makuoi | Northern Illinois | Tennessee State | -3.77 |
| 111 | G | Kam Farris | Robert Morris | Marist | -3.89 |
| 349 | G | Aquan Smart | Florida International | Southeast Missouri State | -3.99 |
| 118 | G | Chris Ford | Davidson | Robert Morris | -4.23 |
| 149 | G | Devon Hancock | Milwaukee | Louisiana�Monroe | -4.56 |
| 285 | F | Kyle Owens | Montana | UC Riverside | -5.24 |
*Some players may be exluded to due to inconsistencies when merging data from different sources.*
Model Accuracy
After the completion of the 2022-23 NCAA basketball season, it is time to go back and evaluate my transfer predictions. As a reminder, the goal of this model is to identify “effective” college basketball transfers. What exactly “effective” means is subjective, but for this case I've decided to evaluate an effective transfer as one who has matched or exceeded a BPM value of two. I'm choosing this benchmark because I believe that outscoring an opponent by two more points per 100 possessions compared to an average producer qualifies you as an “effective” player. Once again, there are many valid opinions on what makes an effective player, and many of those pay no consideration to BPM. With that being said, BPM provides a quality advanced statistic that can serve as a useful benchmark for evaluation.
Now for the question of how accurate my model was in predicting effective transfers. Of the 130 transfers that my model predicted to have a BPM value greater than or equal to 2, 93 of them actually did. In other words, for every four transfers my model predicted to be “effective”, about three of them actually were (~72% accuracy).
Additionally, of those 37 errors, only 17 of them ended up being negative BPM players, meaning that the team was worse with that player on the floor compared to the average player production. This means that approximately 87% of the time my model predicted a player to be an “effective” transfer, they were at least not a negative contributor. With how many variables go into a player's impact on their new team after transferring, I would say that the model did a strong job of accurately predicting effective transfers this year. In terms of errors going the other way around (predicted to NOT be effective but actually were) my model was also very accurate. Approximately 81% of the time a player was predicted to have a BPM less than 2 by my model, they actually did. With that being said, this kind of error is not as impactful as the first case. If you are expecting someone to be an effective player and they aren't, that is much more damaging than expecting someone to not be an effective player and being pleasantly surprised when they are.